Technical Analysis
Charts show what buyers and sellers have already done. This course teaches you to read that record, build a trade plan from it, and decide your exit before you enter.
This course is for you if
- You want to swing trade or trade intraday with a plan
- You keep buying at the top and selling at the bottom
- You know the basics and want to read charts properly
What you'll learn
Chart foundations
- Chart types and timeframes
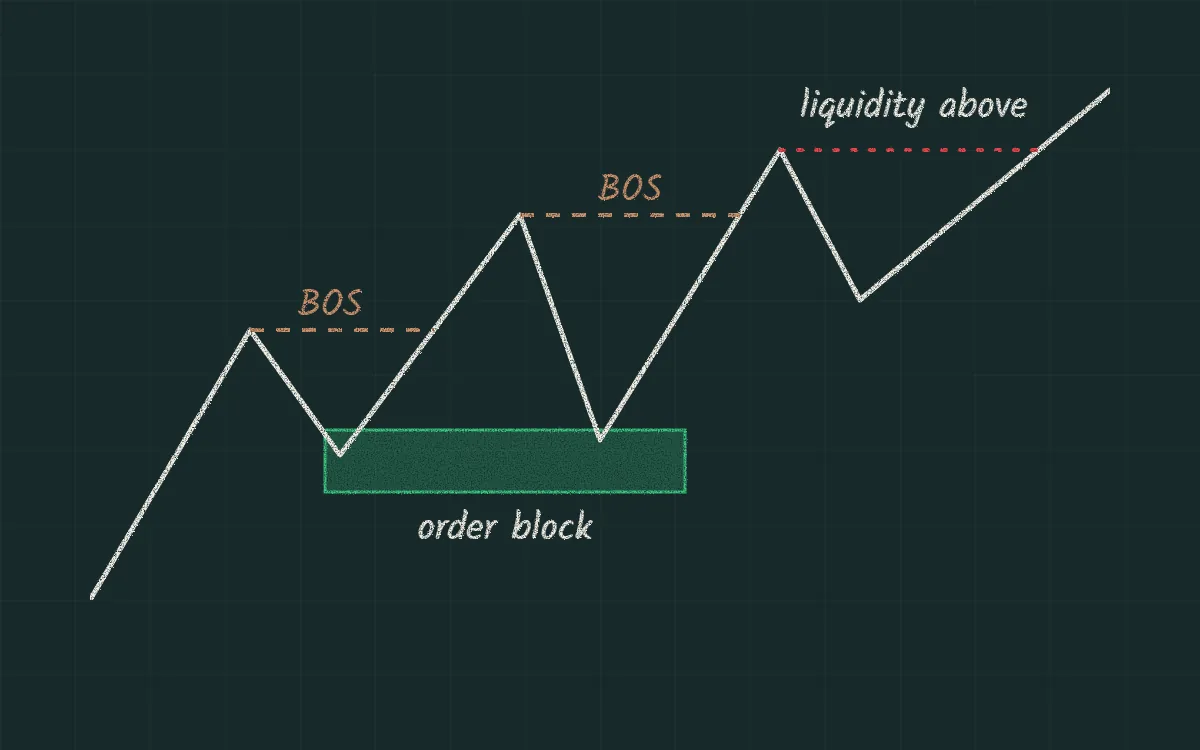
- Dow theory and trends
- Support and resistance
Candlesticks
- Single candle patterns
- Two and three candle patterns
- When a pattern means little
Chart patterns
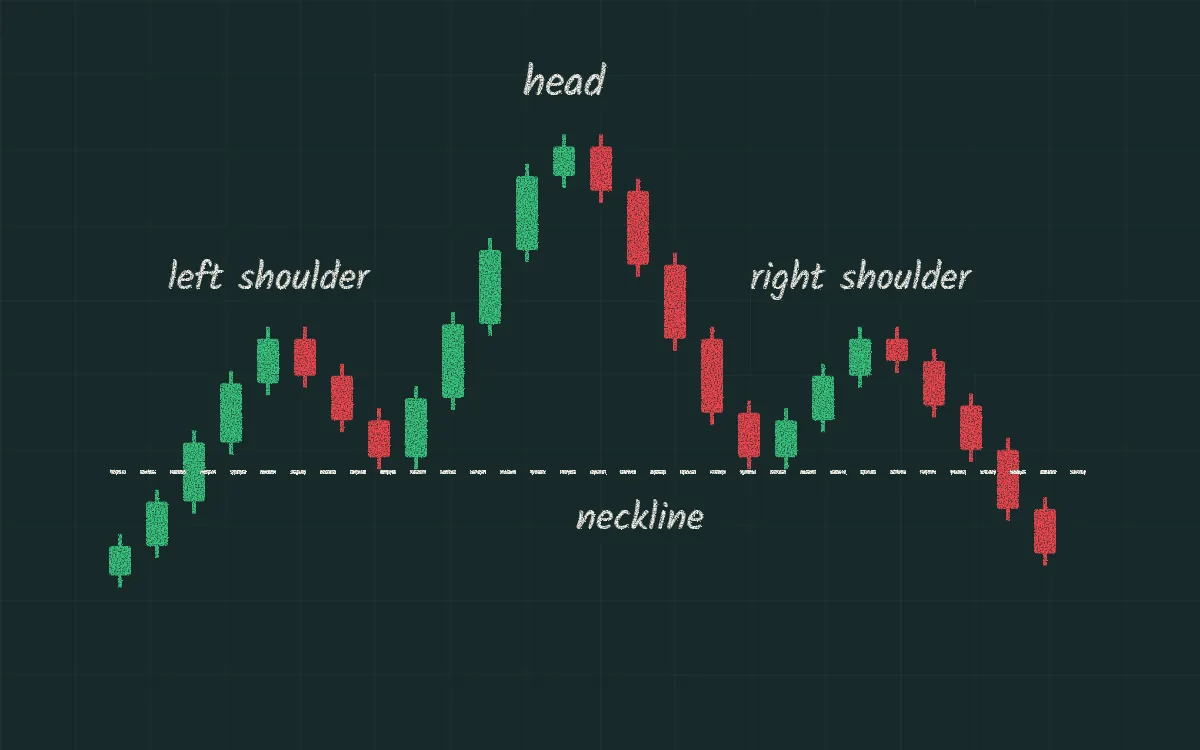
- Head and shoulders
- Double tops and bottoms
- Triangles, flags and channels
- Breakouts and failed breakouts
Indicators and volume
- Moving averages
- RSI and MACD
- Bollinger Bands
- Reading volume alongside price
Planning the trade
- Entry, stop-loss and target
- Risk to reward and position size
- Keeping a trading journal
- Reviewing setups on past charts
By the end, you'll be able to
- Mark support, resistance and trend on any chart
- Recognise the main candlestick and chart patterns, and their limits
- Use common indicators without depending on them
- Write a trade plan with an entry, a stop-loss and a position size
What you need before joining
Comfort with the basics of shares and order types. If you don't have that yet, begin with Stock Market Basics.